
How to make sense of Keegan Bradley? Here are five things I learned about the face of this year's U.S. Ryder Cup team.
The post 5 things about Keegan Bradley I learned writing our magazine story appeared first on Golf.
How to make sense of Keegan Bradley? Here are five things I learned about the face of this year's U.S. Ryder Cup team.
The post 5 things about Keegan Bradley I learned writing our magazine story appeared first on Golf.
John Wood — ex-caddie, book worm and broadcaster — has quietly been playing an important role as the U.S. Ryder Cup team's manager.
The post This ex-caddie is U.S. Ryder Cup team’s Mr. Fix-It (and he’s been busy) appeared first on Golf.
Top-level Tour players like are mixing up their iron sets with different models. Should you? Here's what you should know.
The post Are blended iron sets right for you? An expert explains appeared first on Golf.
Bethpage Black is an American treasure. Here’s the beauty (and strategy) of the best public track on earth, host of the 2025 Ryder Cup.
The post Inside the Ryder Cup arena: Bethpage Black hole-by-hole tour appeared first on Golf.
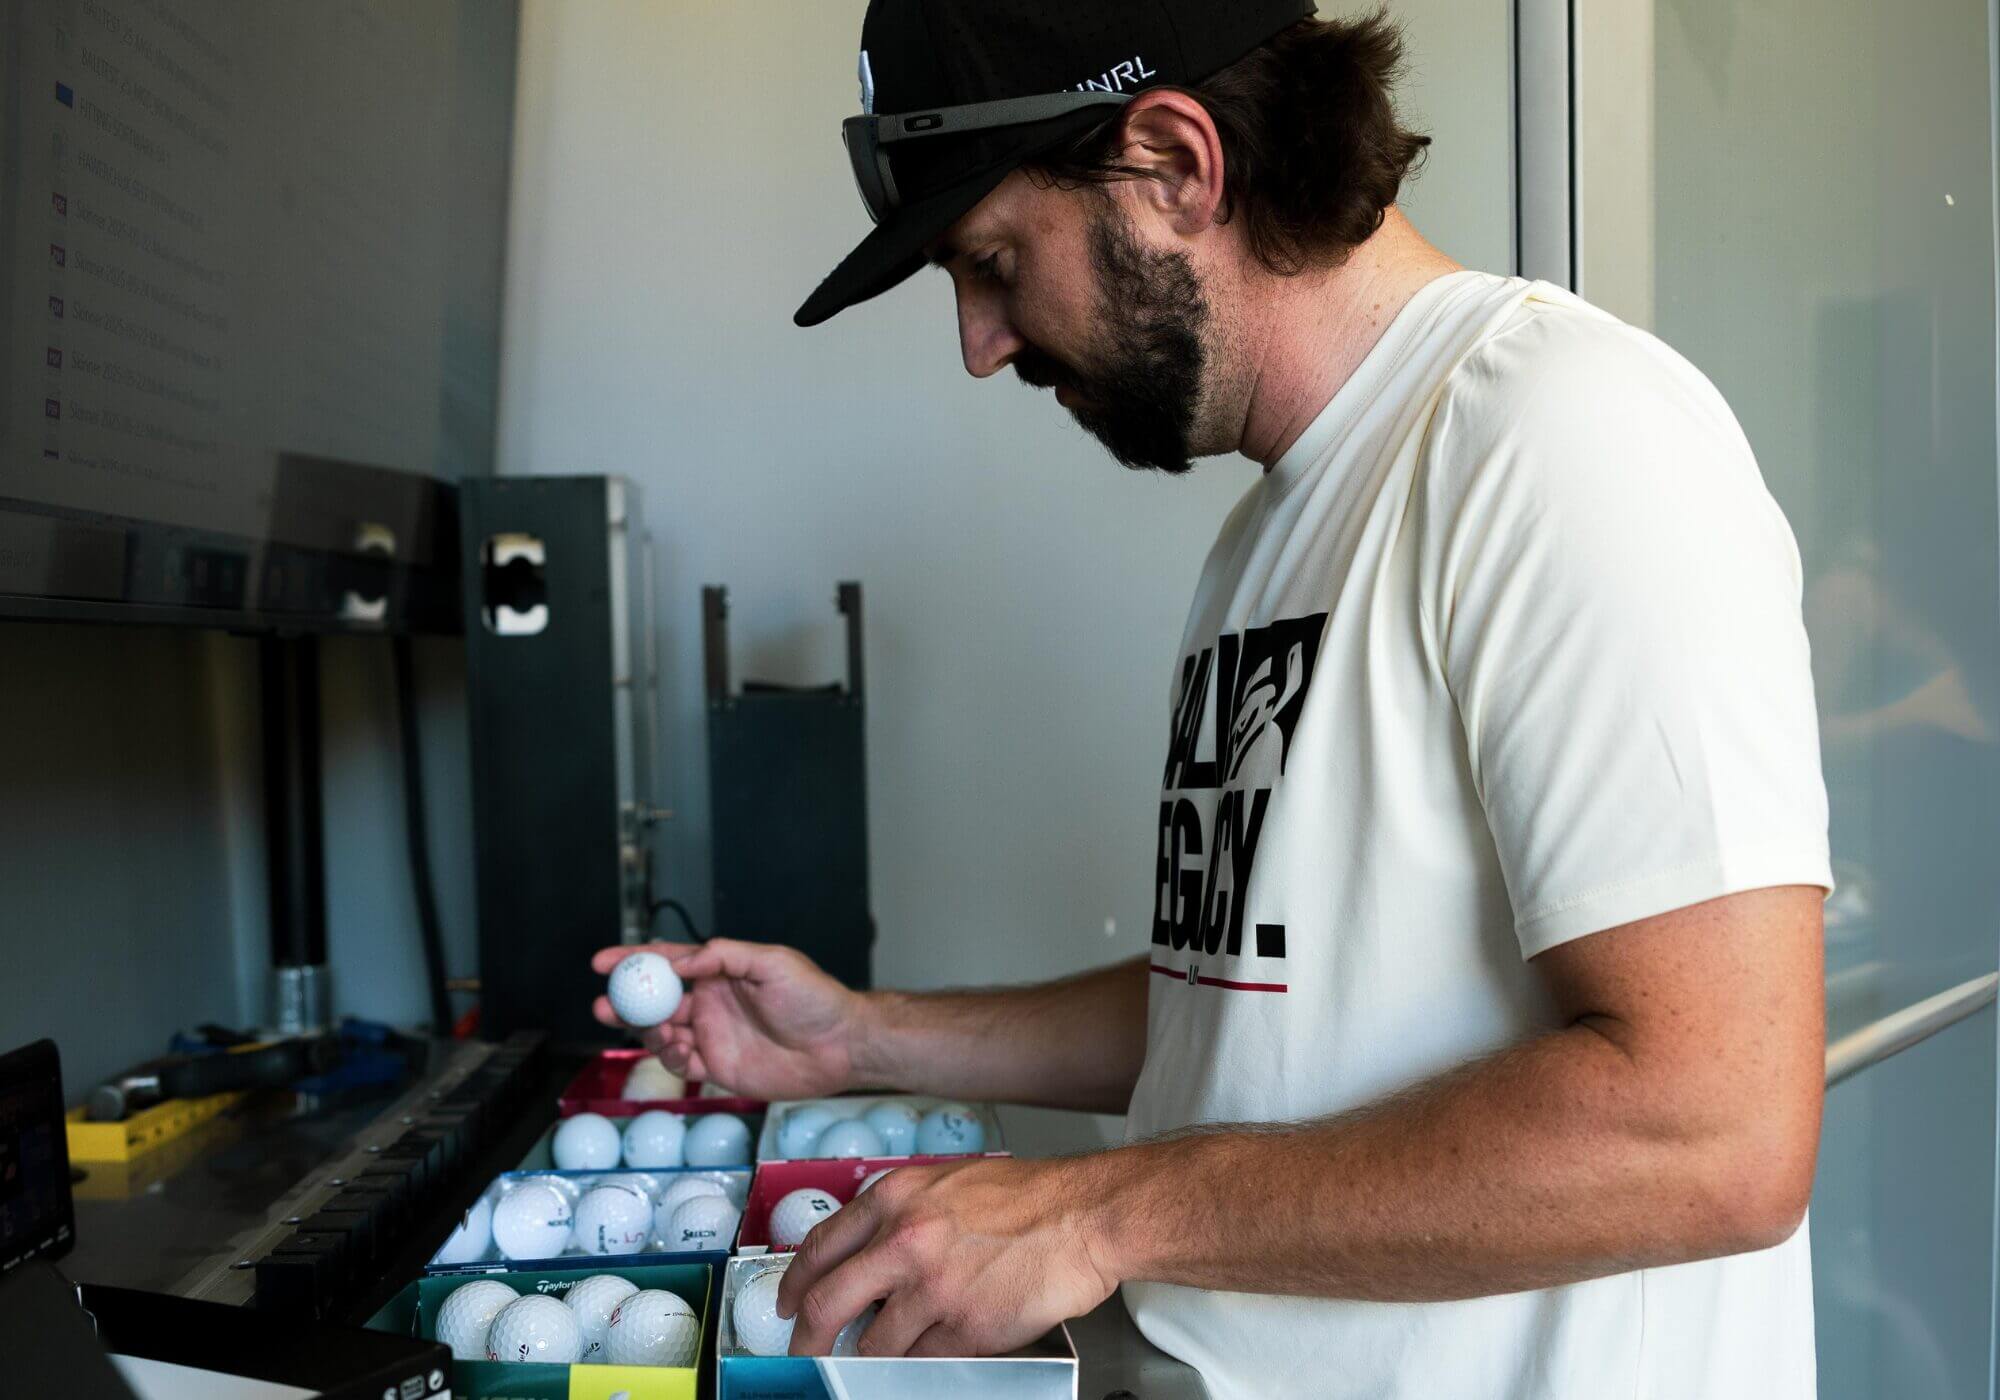
Earlier this year, we published lists of top-selling ionomer golf balls and top-selling urethane balls based on 2024 market share data. Those lists tell us what’s moving off the shelves but they don’t tell us the whole story.
What we really want to know is what you’re playing—and, more importantly, why you chose that ball over all the others.
Are you chasing distance? Spin around the greens? Playing whatever was on sale? Maybe you’re still gaming that sleeve you found in your garage from 2019?
To find out, we’ve put together our 2025 golf ball survey. It’s fewer than 10 questions and should take under five minutes to complete. Plus, if you’d like to be entered in a random drawing to win a $50 Amazon gift card, just enter your email address at the end—it’ll only be used for prize notification.
Here’s what we’re hoping to uncover: Which balls are MyGolfSpy readers actually putting in play? What drives your golf ball decisions? And how do your choices compare to what the broader market is buying?
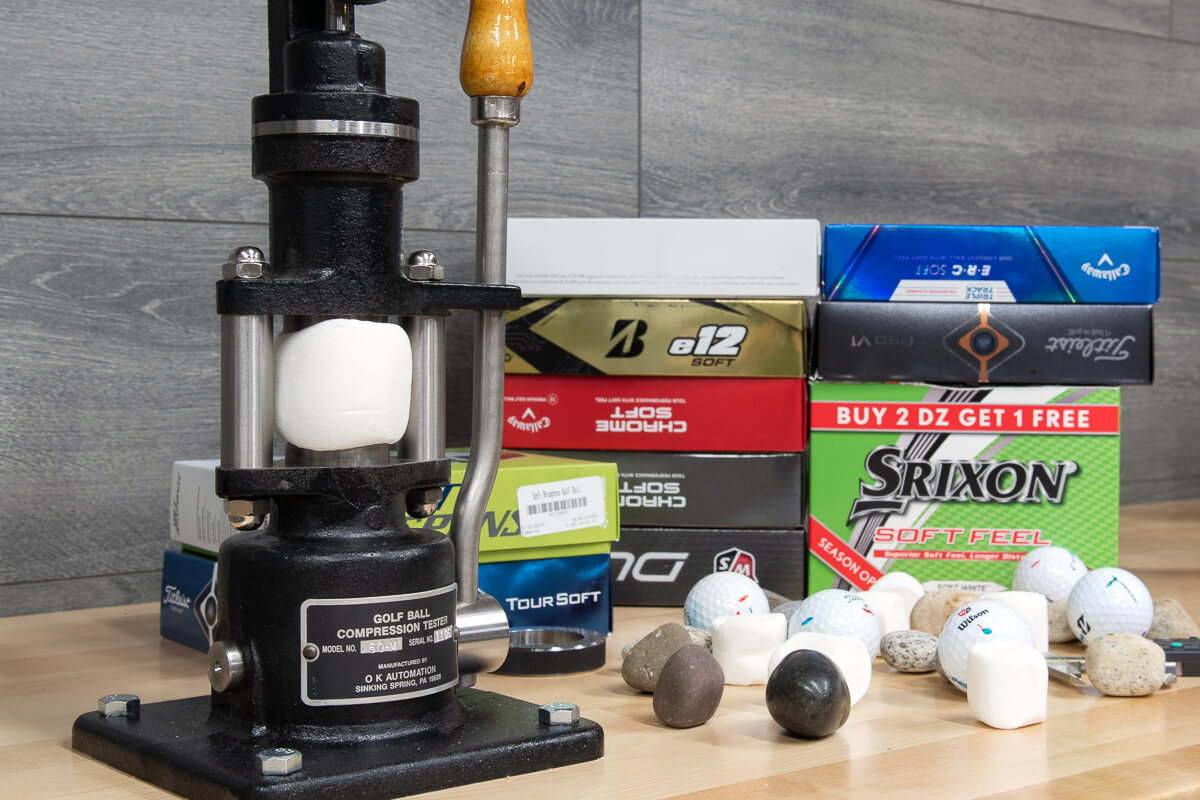
Here’s something that might surprise you: the difference between a good golf ball and a great one isn’t always about the latest technology or whatever performance claims are printed on the box. It’s about consistency. And consistency—the thing that separates a ball that performs the same way shot after shot from one that leaves you guessing—boils down to manufacturing quality.
Most golfers can’t tell you why one ball flies straighter than another or why some models seem to perform differently from one dozen to the next. That’s not their fault. Identifying quality defects in golf balls is extremely difficult without specialized equipment. A ball that’s slightly out of round or has an inconsistent core might look identical to a perfectly manufactured one but the performance differences can be significant.
The reality is this: while there are plenty of good golf balls on the market today, there’s a substantial gap between the best-made balls and the worst. Understanding what separates them can help you make smarter equipment decisions and, more importantly, play more consistent golf.
So what determines whether a golf ball is made well or made poorly? It comes down to four key factors, each playing a critical role in the consistency and performance of the finished product.
If there’s one thing that matters more than anything else when it comes to golf ball quality, it’s where the ball is made. Not all factories are created equal—not even close.


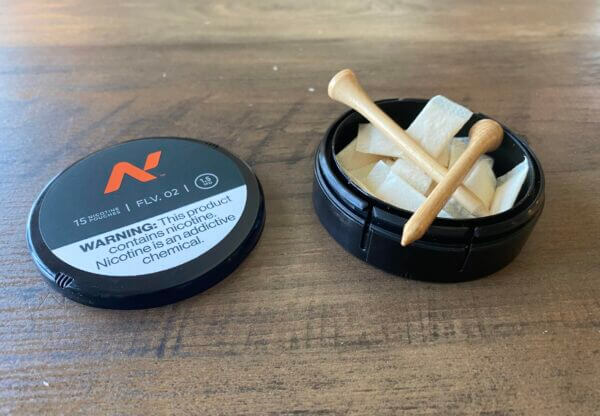
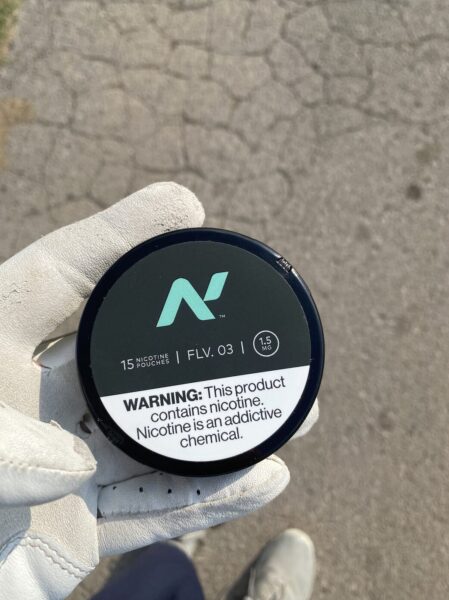
If you’ve been playing golf over the past handful of years, you have surely seen nicotine tins popping up all over the place.
For the unaware, nicotine pouches are smoke-free, tobacco-free products you place in between your upper lip and gum. The pouches, which last for about an hour, give you a certain high that boosts your alertness while also increasing heart rate and blood pressure.
They are safer than smoking cigarettes but still addictive. And golfers love them.
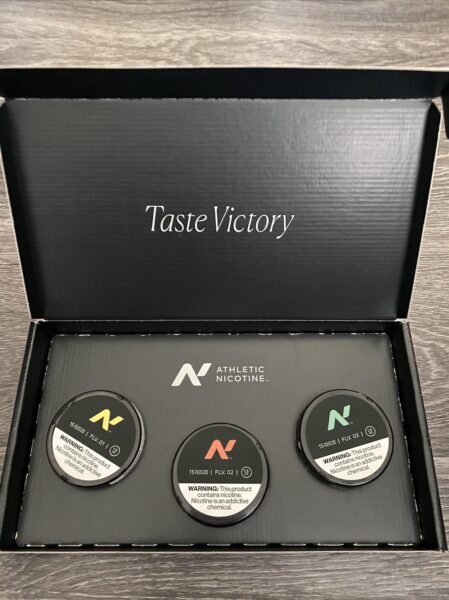
I’m going to brutally honest with you. I am not a nicotine user in any form. Until a few weeks ago, I had never even tried it. I don’t have a good reason for that other than my vices being in other categories.
And, generally speaking, I just assumed that unserious golfers use nicotine as an alternative to drinking so they have an even better time on the course.
I recently wrote about how more golfers than ever are not fixing their ball marks.
Whether it’s a municipal course, a resort course or a private course, greens have become littered with unfixed ball marks. Curiously, some of the nicer clubs I’ve been to are among the worst offenders.
The issue is a mix of a few variables. Perhaps the most pressing concern is that an influx of new golfers have come into the game without the knowledge (or maybe the desire) to understand why this matters.
And that’s not to excuse seasoned golfers, either. There are way more golfers not fixing their ball marks than those who are fixing them.
Ball marks that are not fixed can take a few weeks to heal, according to the USGA. That makes greens bumpier for everyone.
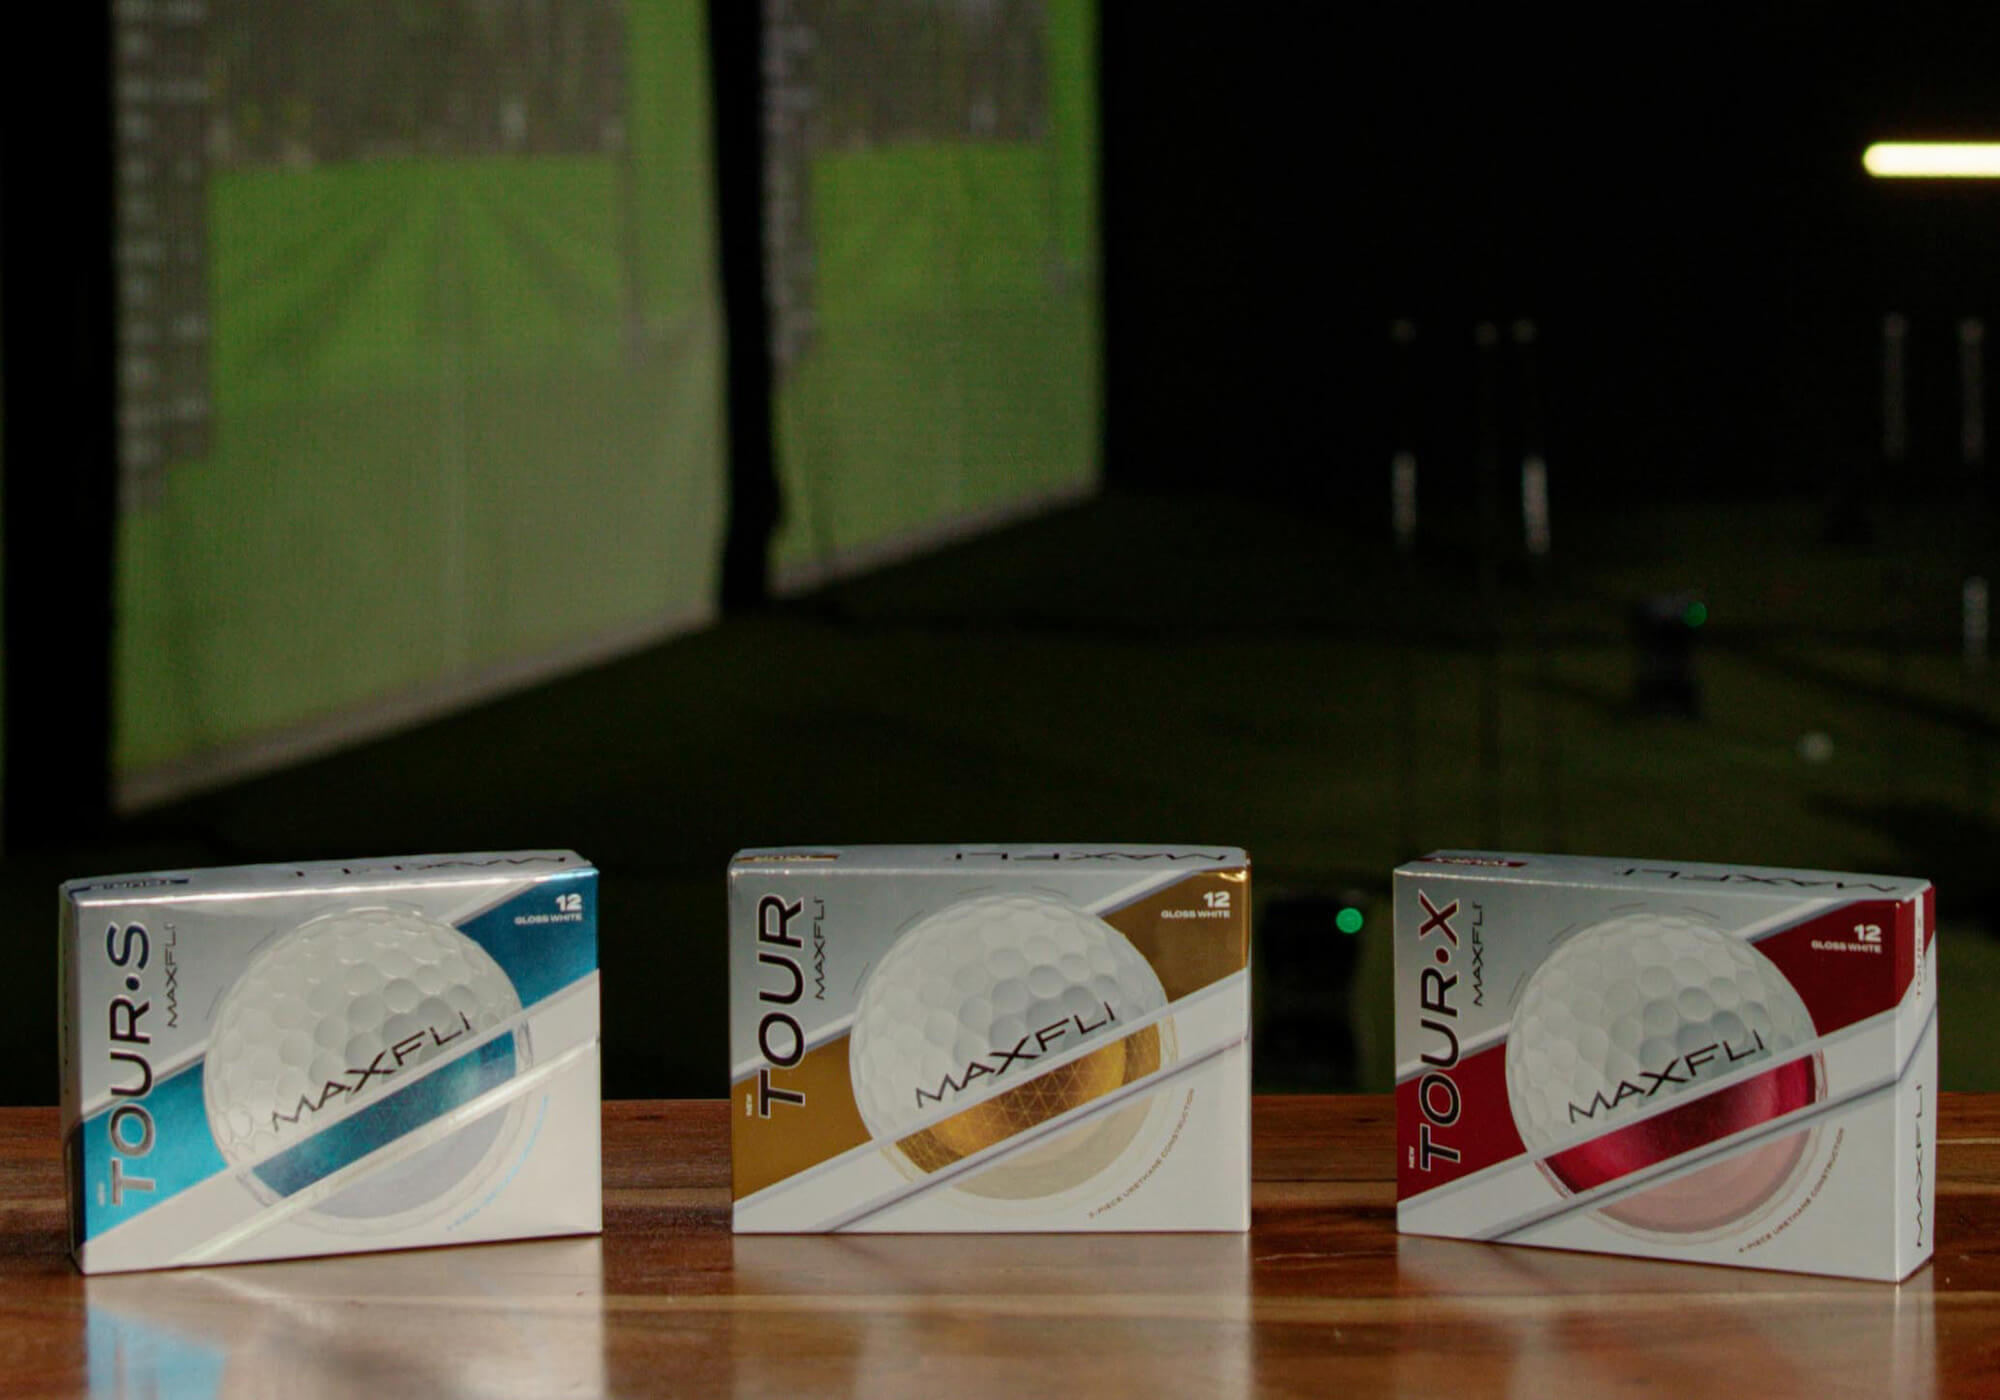
We polled our Forum members on their Most Wanted Ball of 2025 and the results are in: the Maxfli Tour X took the overall win with the Tour and Tour S earning plenty of love as well. For those who have been following the MyGolfSpy 2025 Ball Test, it’s no surprise that our Forum members are high on this relative newcomer. But the better story is why. What makes golfers reach for Maxfli over the big-name tour balls? We asked members to make their best case—performance, price, feel, durability, alignment aids. Here’s what they said.
Value meets “tour-level” performance
Bang for your buck. Yards per dollar. Premium performance packaged at a price for a pauper (I’m a sucker for alliteration).
“Maxfli Tour has the best performance for the dollar… rivals Pro V1/TP5/Chrome at a fraction of the cost. In-app sales as low as $25/dzn.” — Shrek74
“I play Tour X for feel, consistency, durability, spin. Only ball as good for me is Pro V1x—and that’s $25 more per dozen.” — JB2334


Look, I love it when collabs actually make sense. Most of the time, we get partnerships that feel like they were dreamed up by throwing darts at a board of random brands (still holding out for Titleist x Old Spice).
But every once in a while, something comes along that’s so perfectly on the nose it actually works – like Sunday Swagger teaming up with Uncrustables (because nothing says golf fashion quite like golf’s semi-official sandwich).
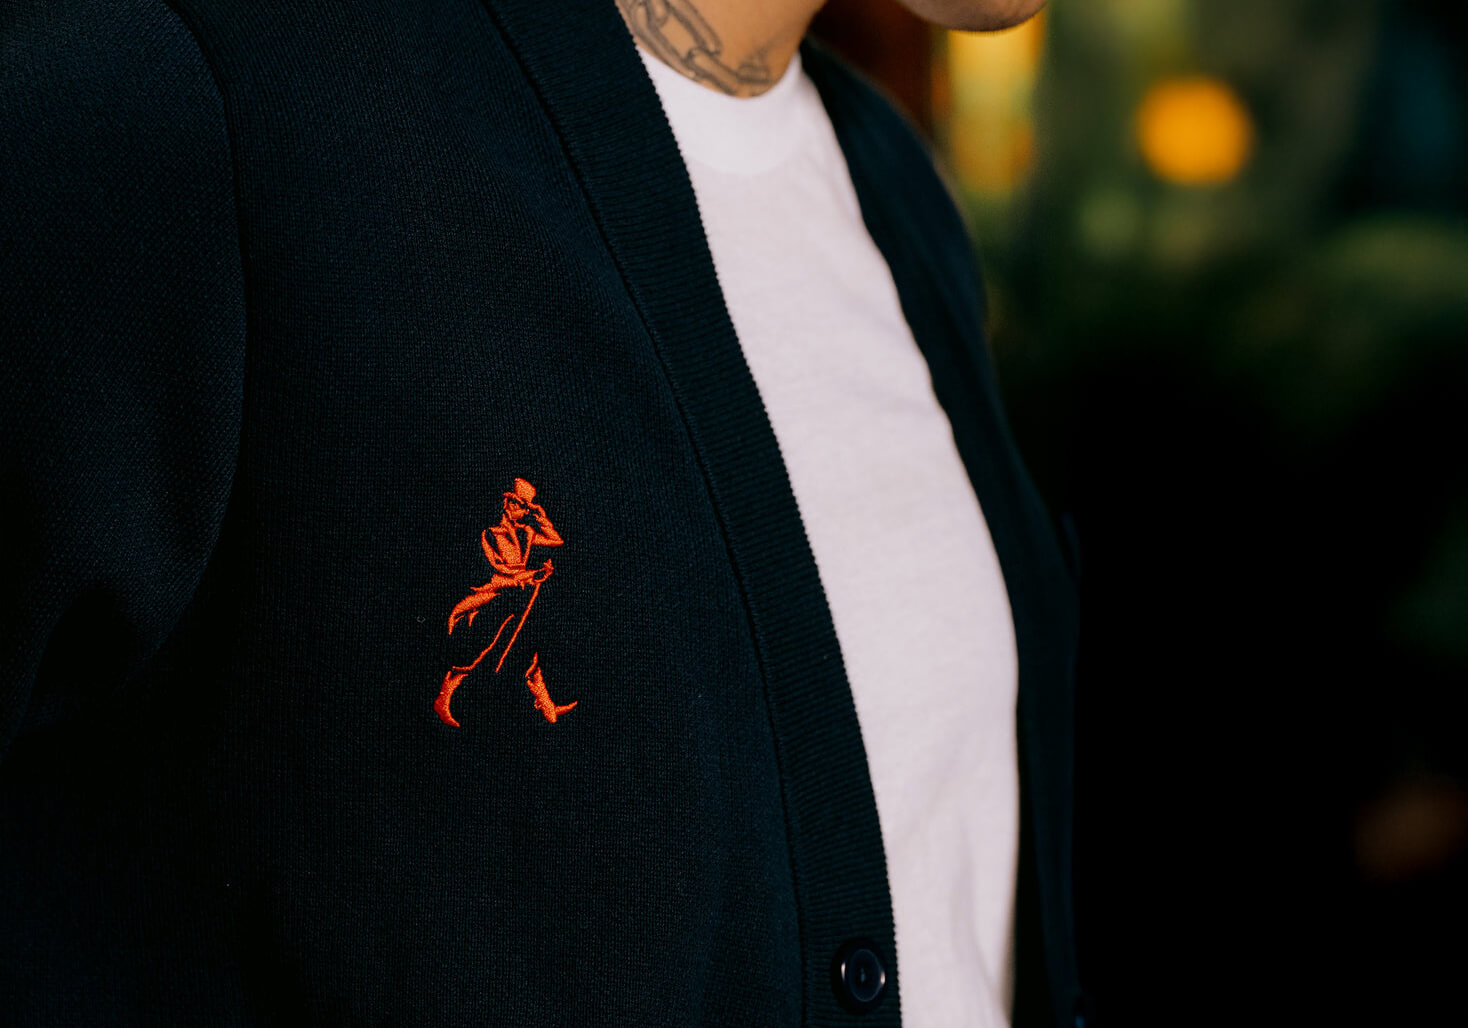
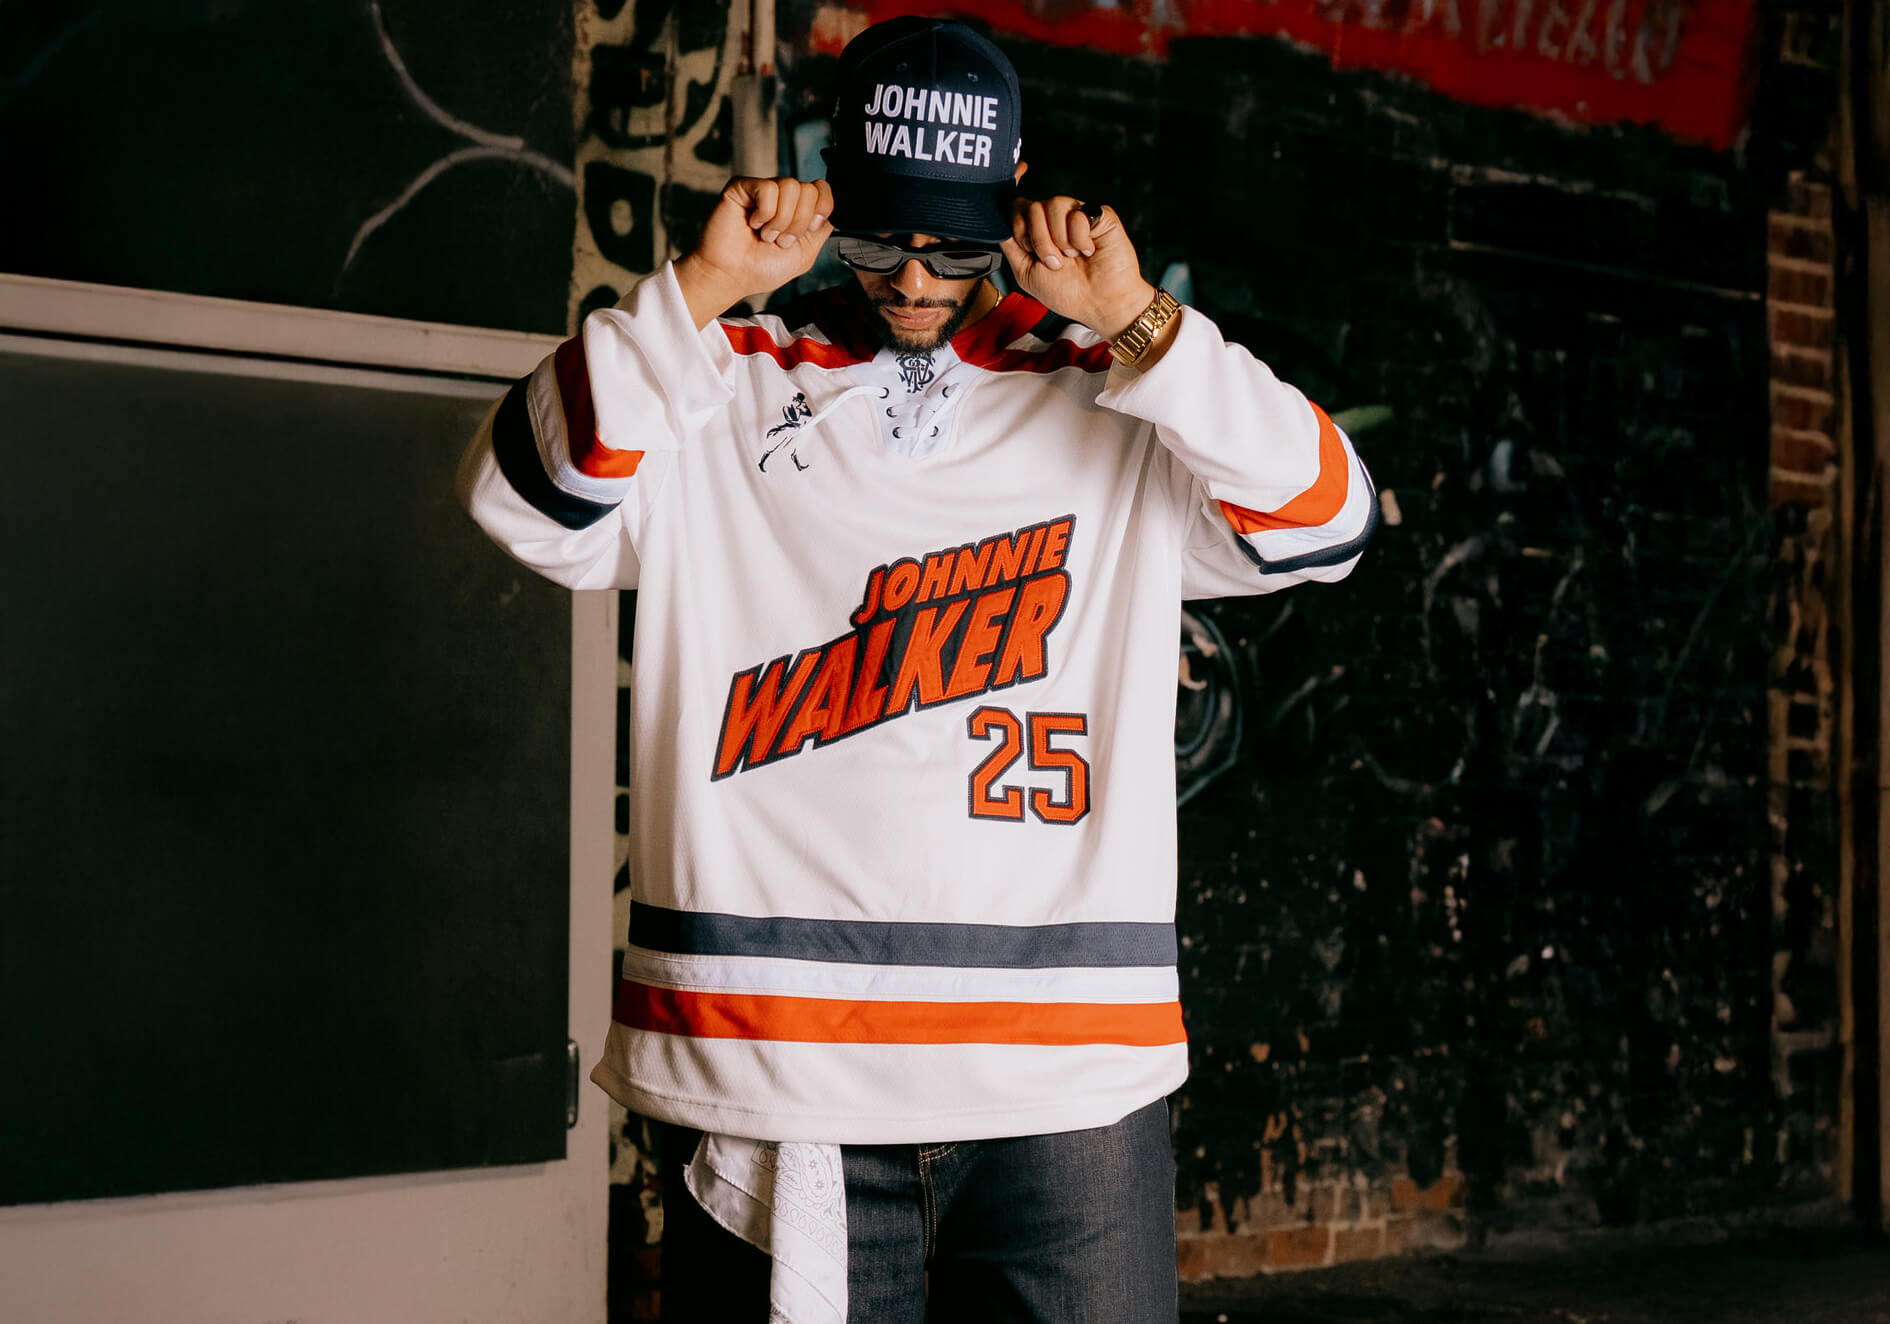
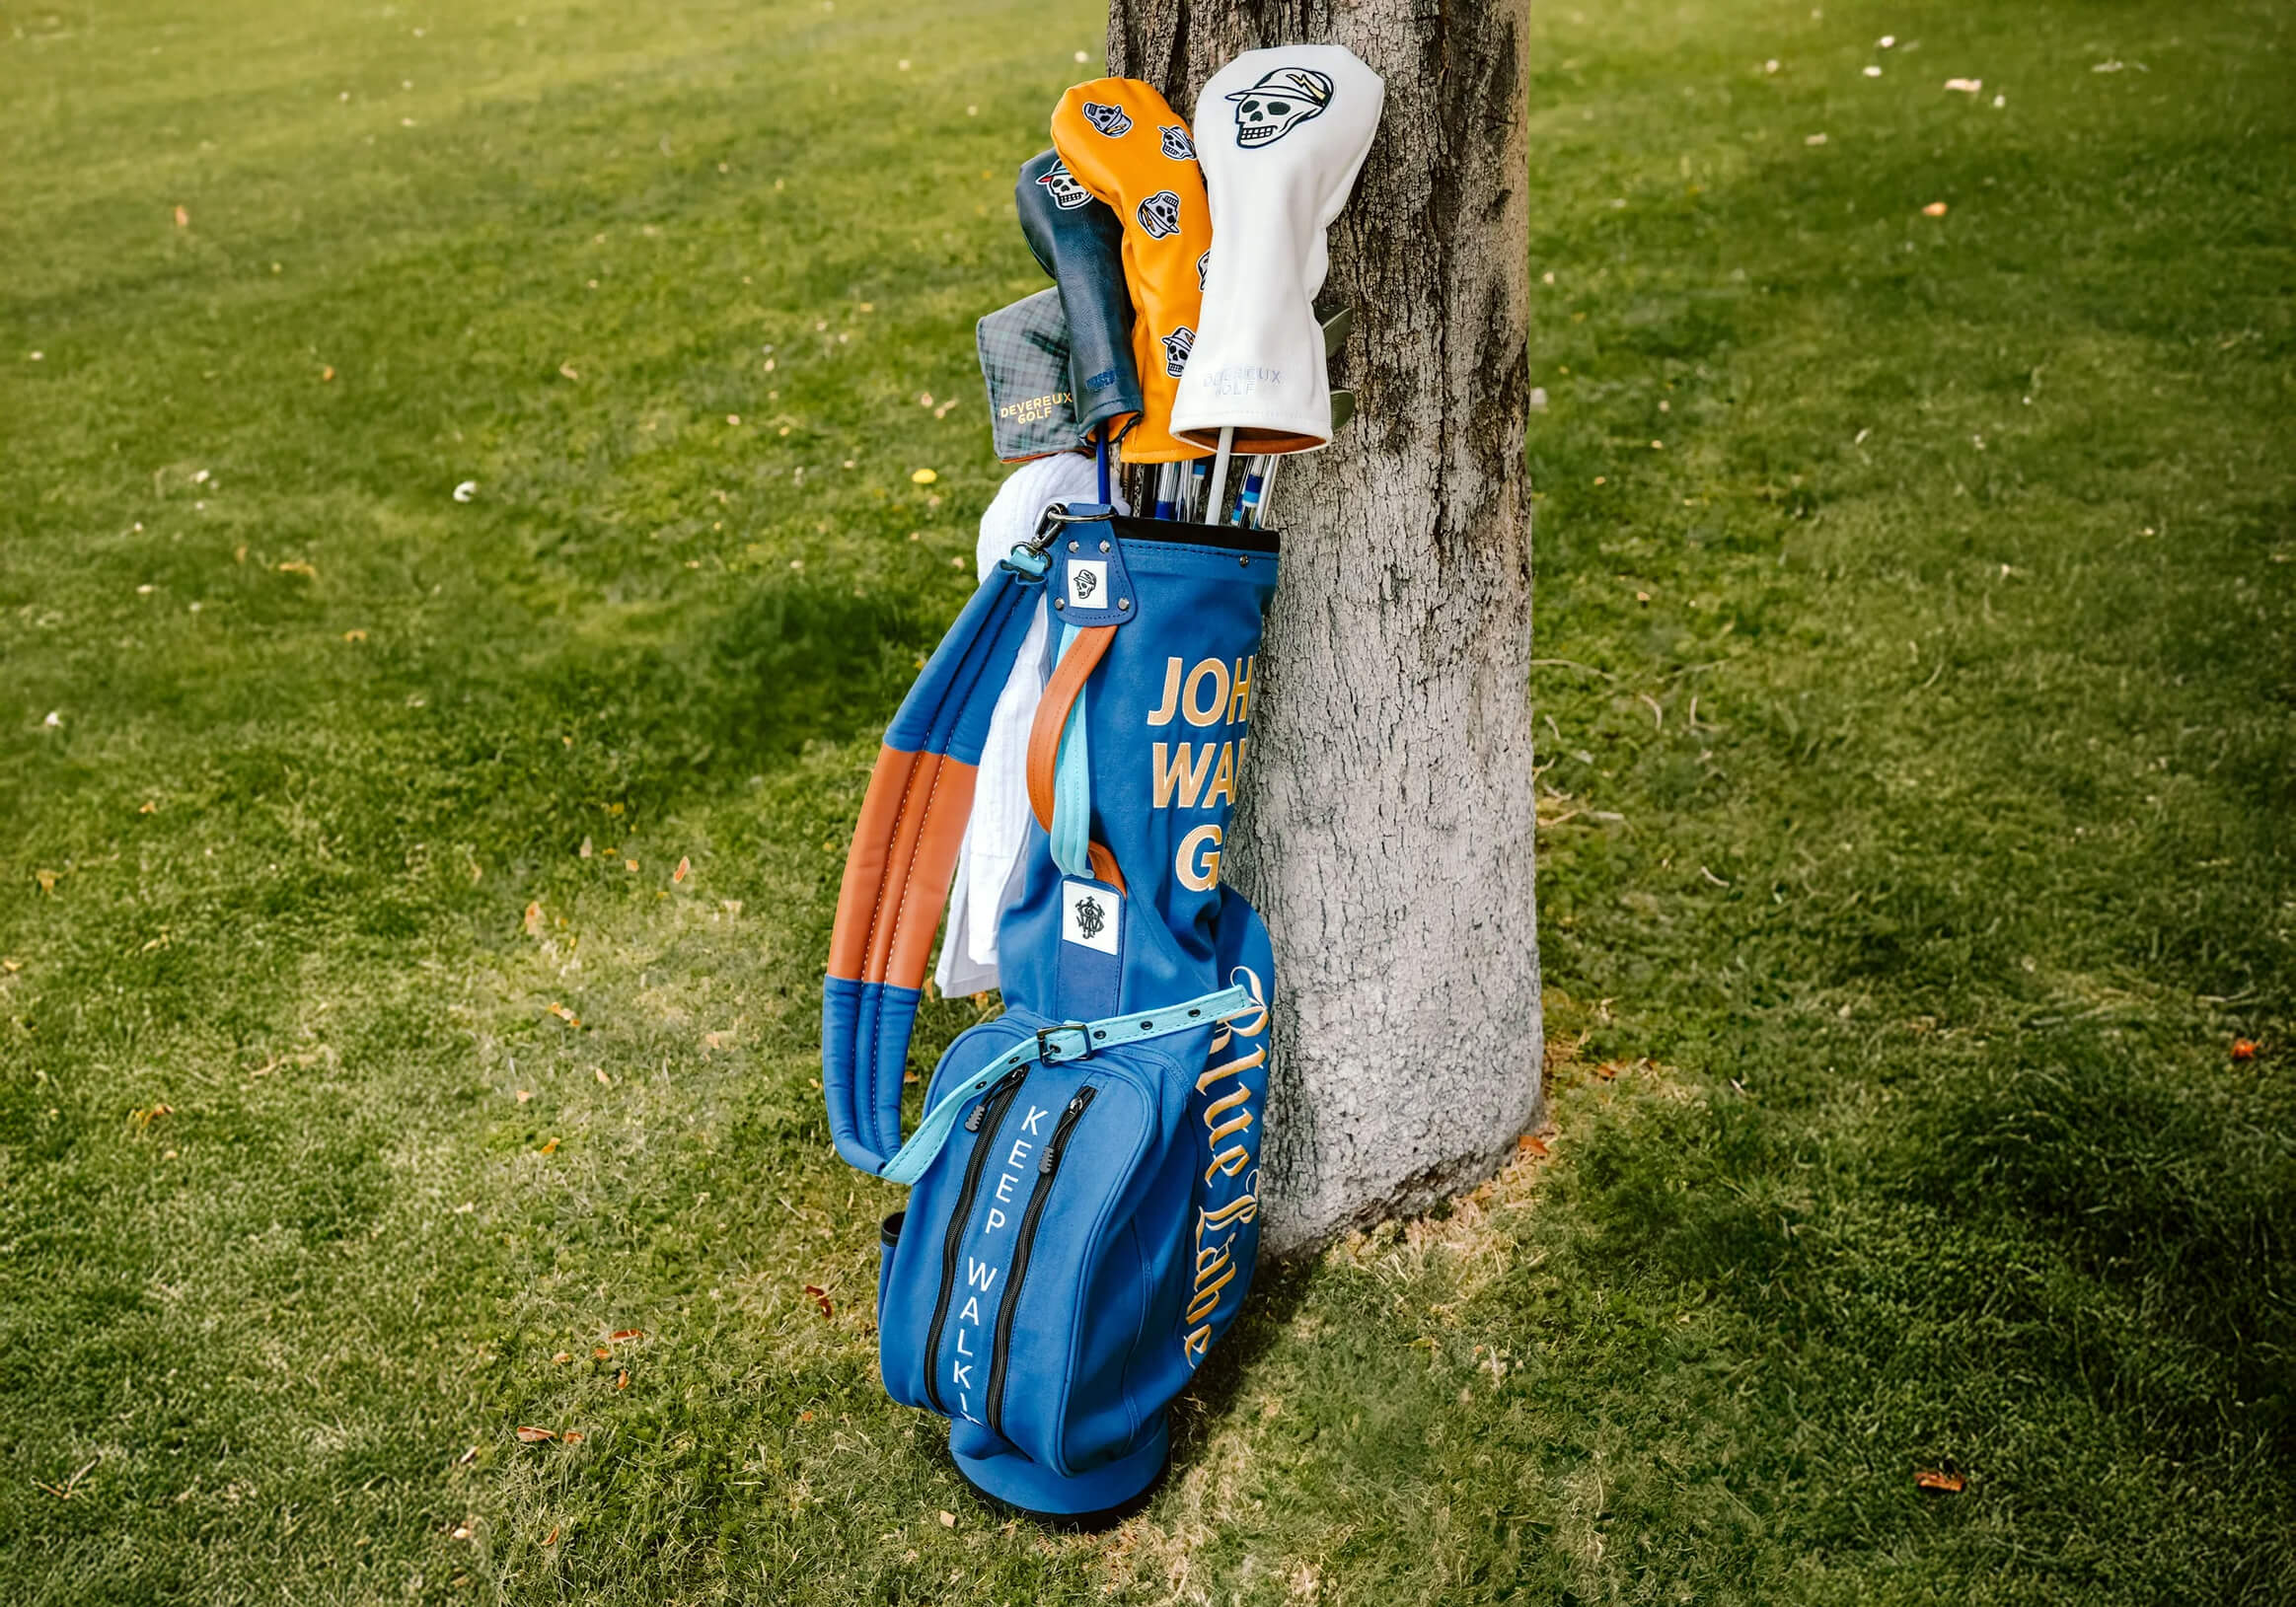
Enter the Johnnie Walker x Devereux Golf “Spirit of the Cup” collection and, friends, this one hits different. Golf and whisky? It’s such a natural pairing that you’d think every distillery would have a golf line by now. Maybe they do (it’s possible I got really drunk and forgot), but this one actually feels thought out.
With the Ryder Cup heading to Bethpage for the first time, Johnnie Walker decided to lean into golf’s most spirited (see what I did there?) rivalry with a collection that includes everything from hockey jerseys (I’ll get to that) to cocktail kits that’ll be perfect for Americans celebrating victory and Europeans drowning their sorrows in the kind of premium Scotch whisky that losers don’t deserve.
Let’s start with the Johnnie Walker Knitted Cardigan because, apparently, we’ve reached peak golf when whisky companies are making sweaters. Crafted from soft knitted cotton with the Johnnie Walker Golf Club logo on the back and featuring a “Striding Man and Skull Caddie” on the front. The tipped red sleeve adds what they’re calling “a subtle pop of distinction,” marketing speak for “look, we put whisky branding on a golf sweater and somehow it works.”


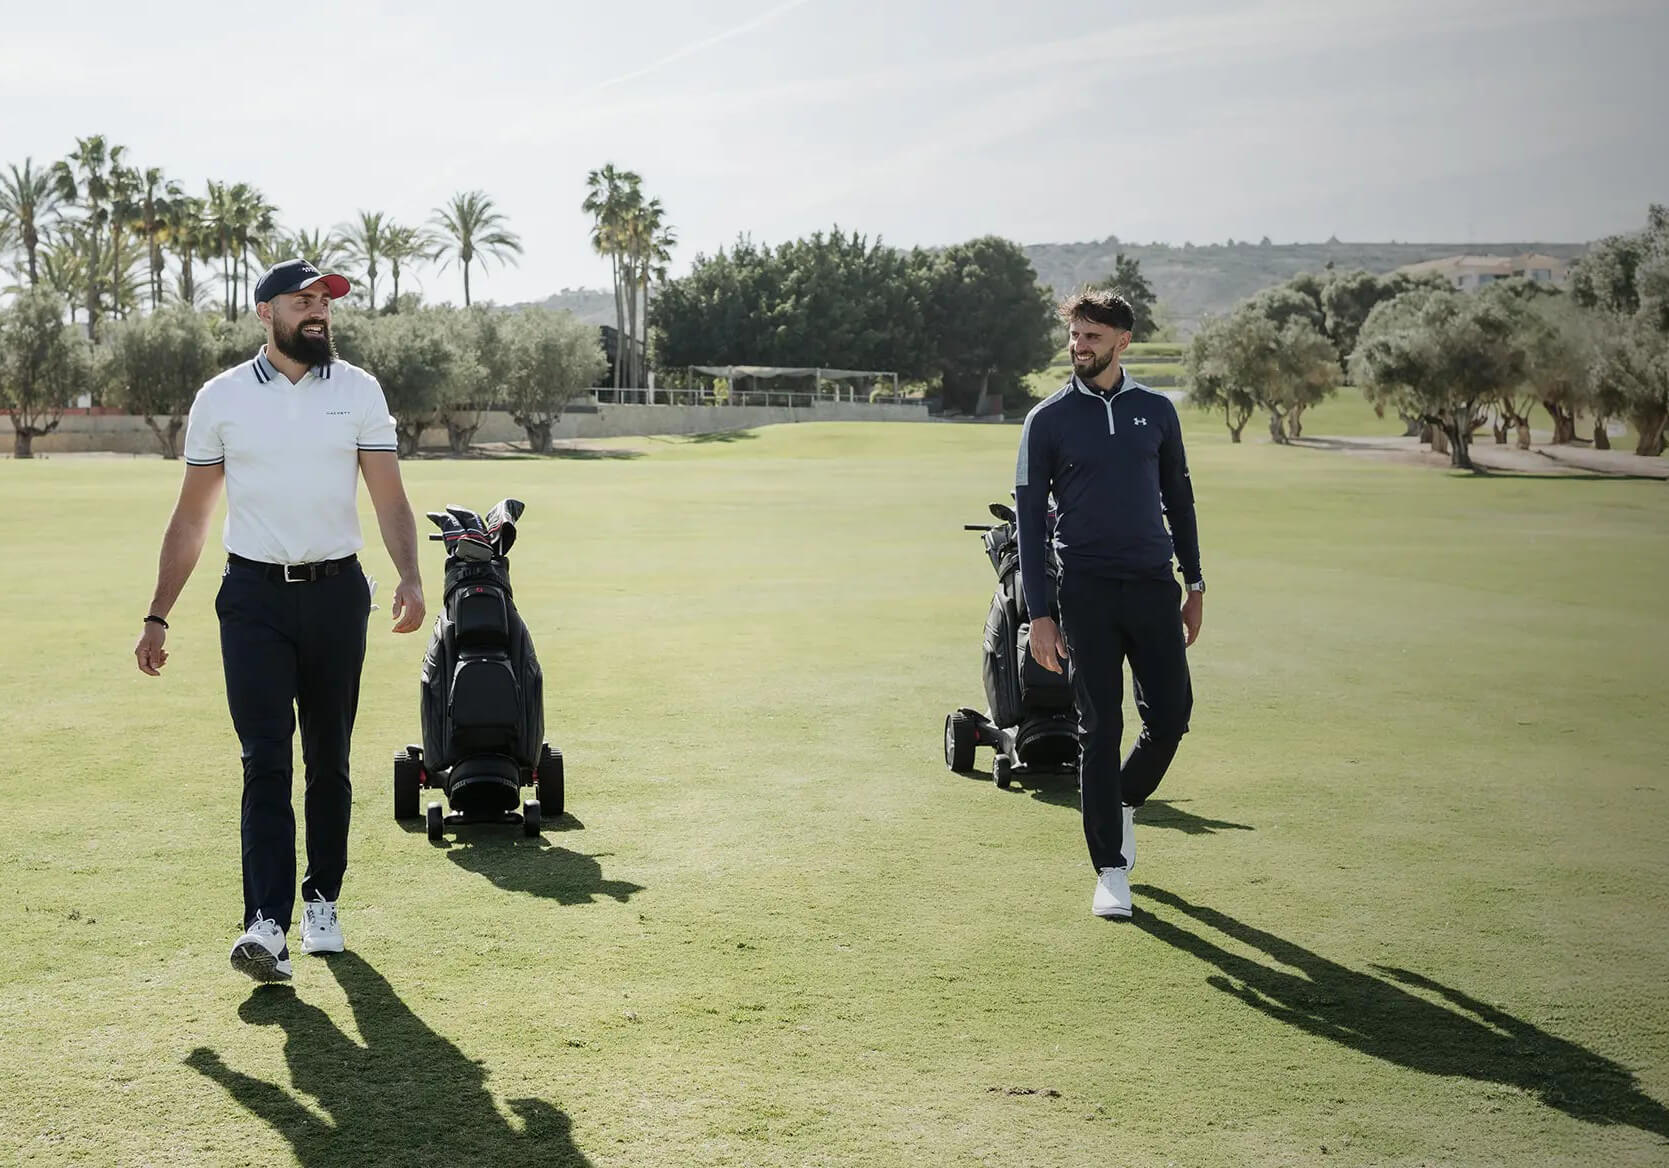
Electric push carts are having a moment. They represent the perfect middle ground between the pure enjoyment of walking the course and the low-effort convenience of riding in a cart. You get the exercise, the pace, and the connection to the game that comes with walking, but without showing up to the 18th tee completely gassed.
My wife likes it when I don’t come home from golf and immediately take a nap (especially when I skip the showering part).
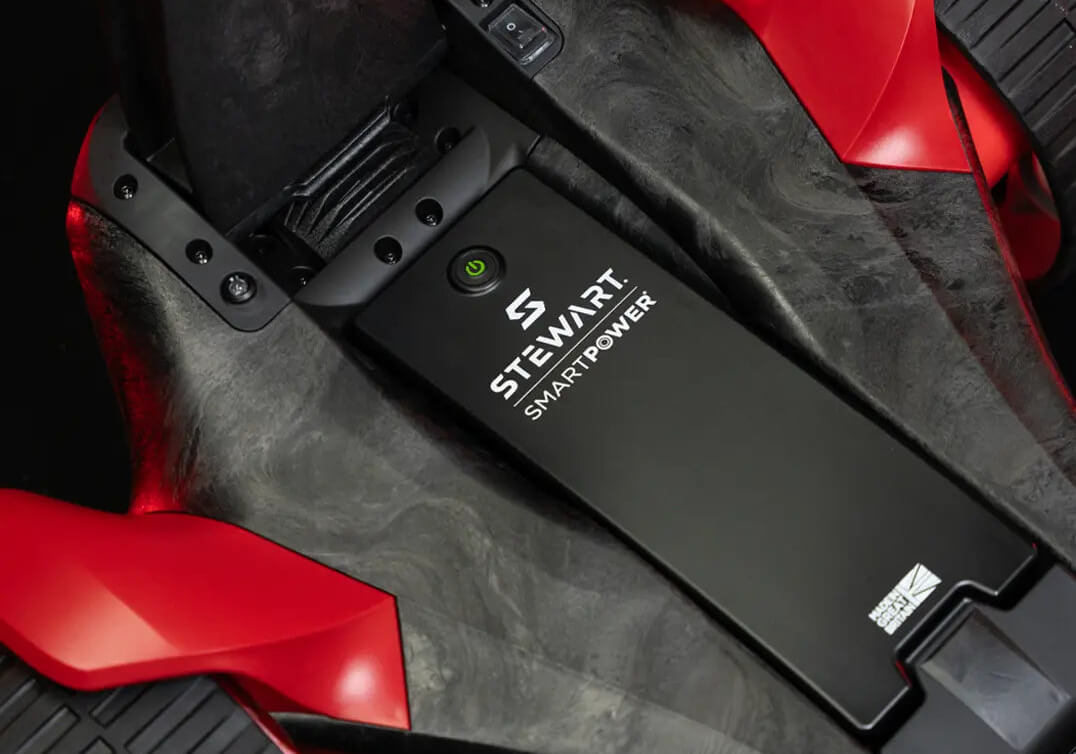
For golfers who’ve embraced the electric cart lifestyle, Stewart Golf has long been among the category leaders. Their Q Follow has performed well in Most Wanted testing and racked up rave reviews. And now it’s even better.
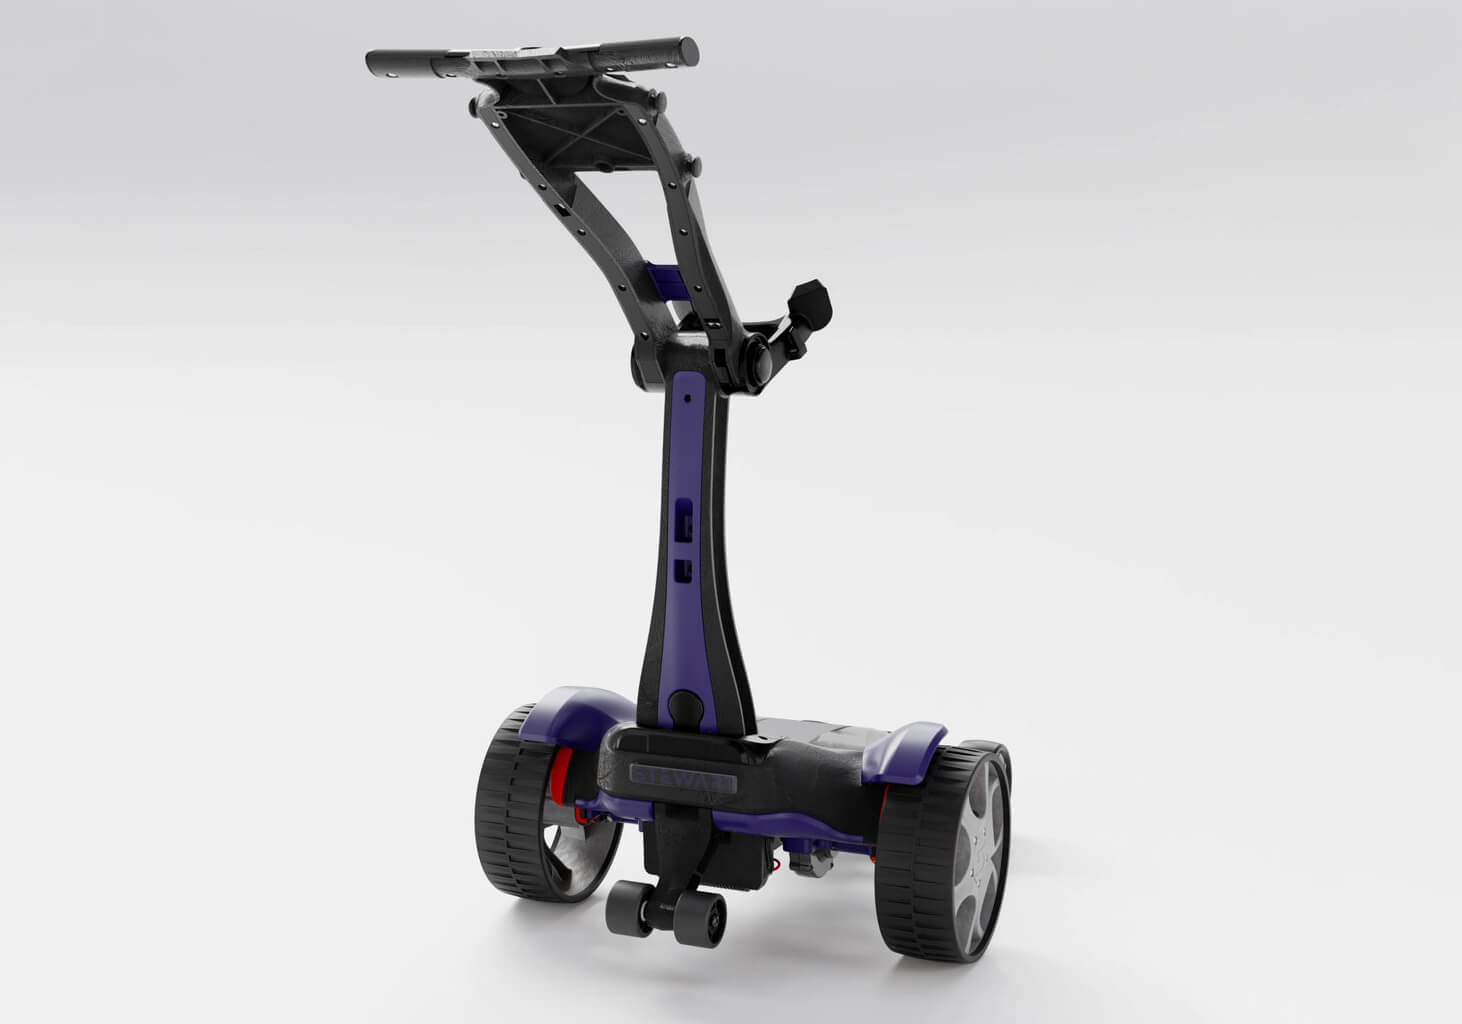
Stewart Golf has rolled out the eighth generation of their industry-leading Follow technology and the improvements are substantial. The updated system is more responsive and intuitive, giving you that seamless, hands-free experience whether you’re navigating fairways, rough or pretty much any terrain.
One of the standout upgrades is the extended remote range. The new system works from nearly 100 yards away, which means you can send your cart wandering off to find your ball in the woods while you pretend to look for it from the safety of the fairway. It’s like having a loyal golden retriever, except it won’t judge you for that slice and it actually comes back when you call it.
I gotta admit it. I don’t get fashion.
It’s one of the few things my wife and I agree on.
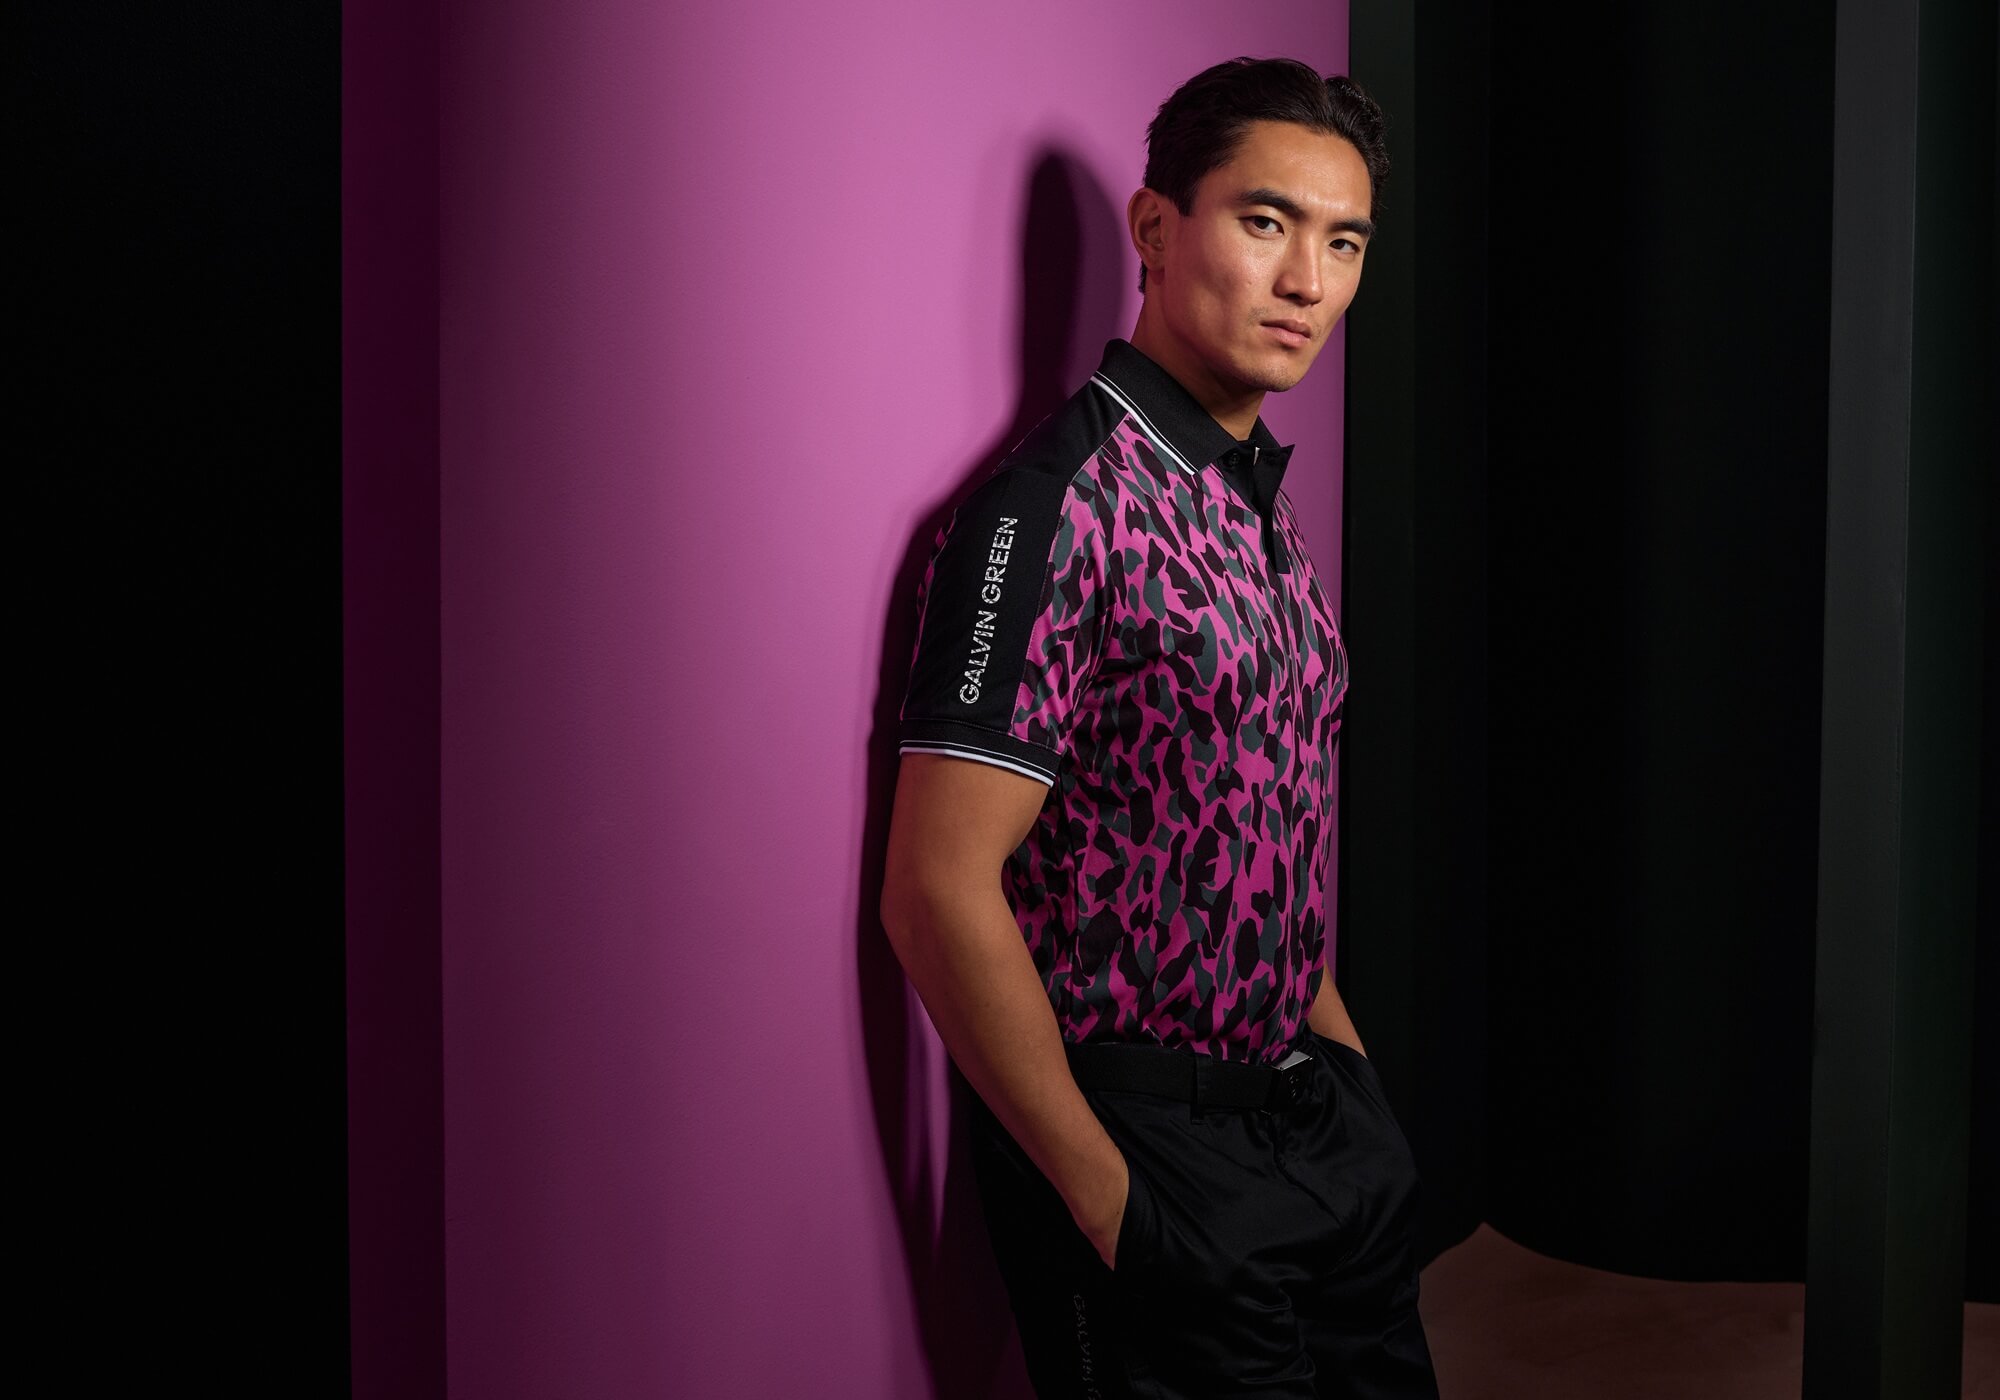
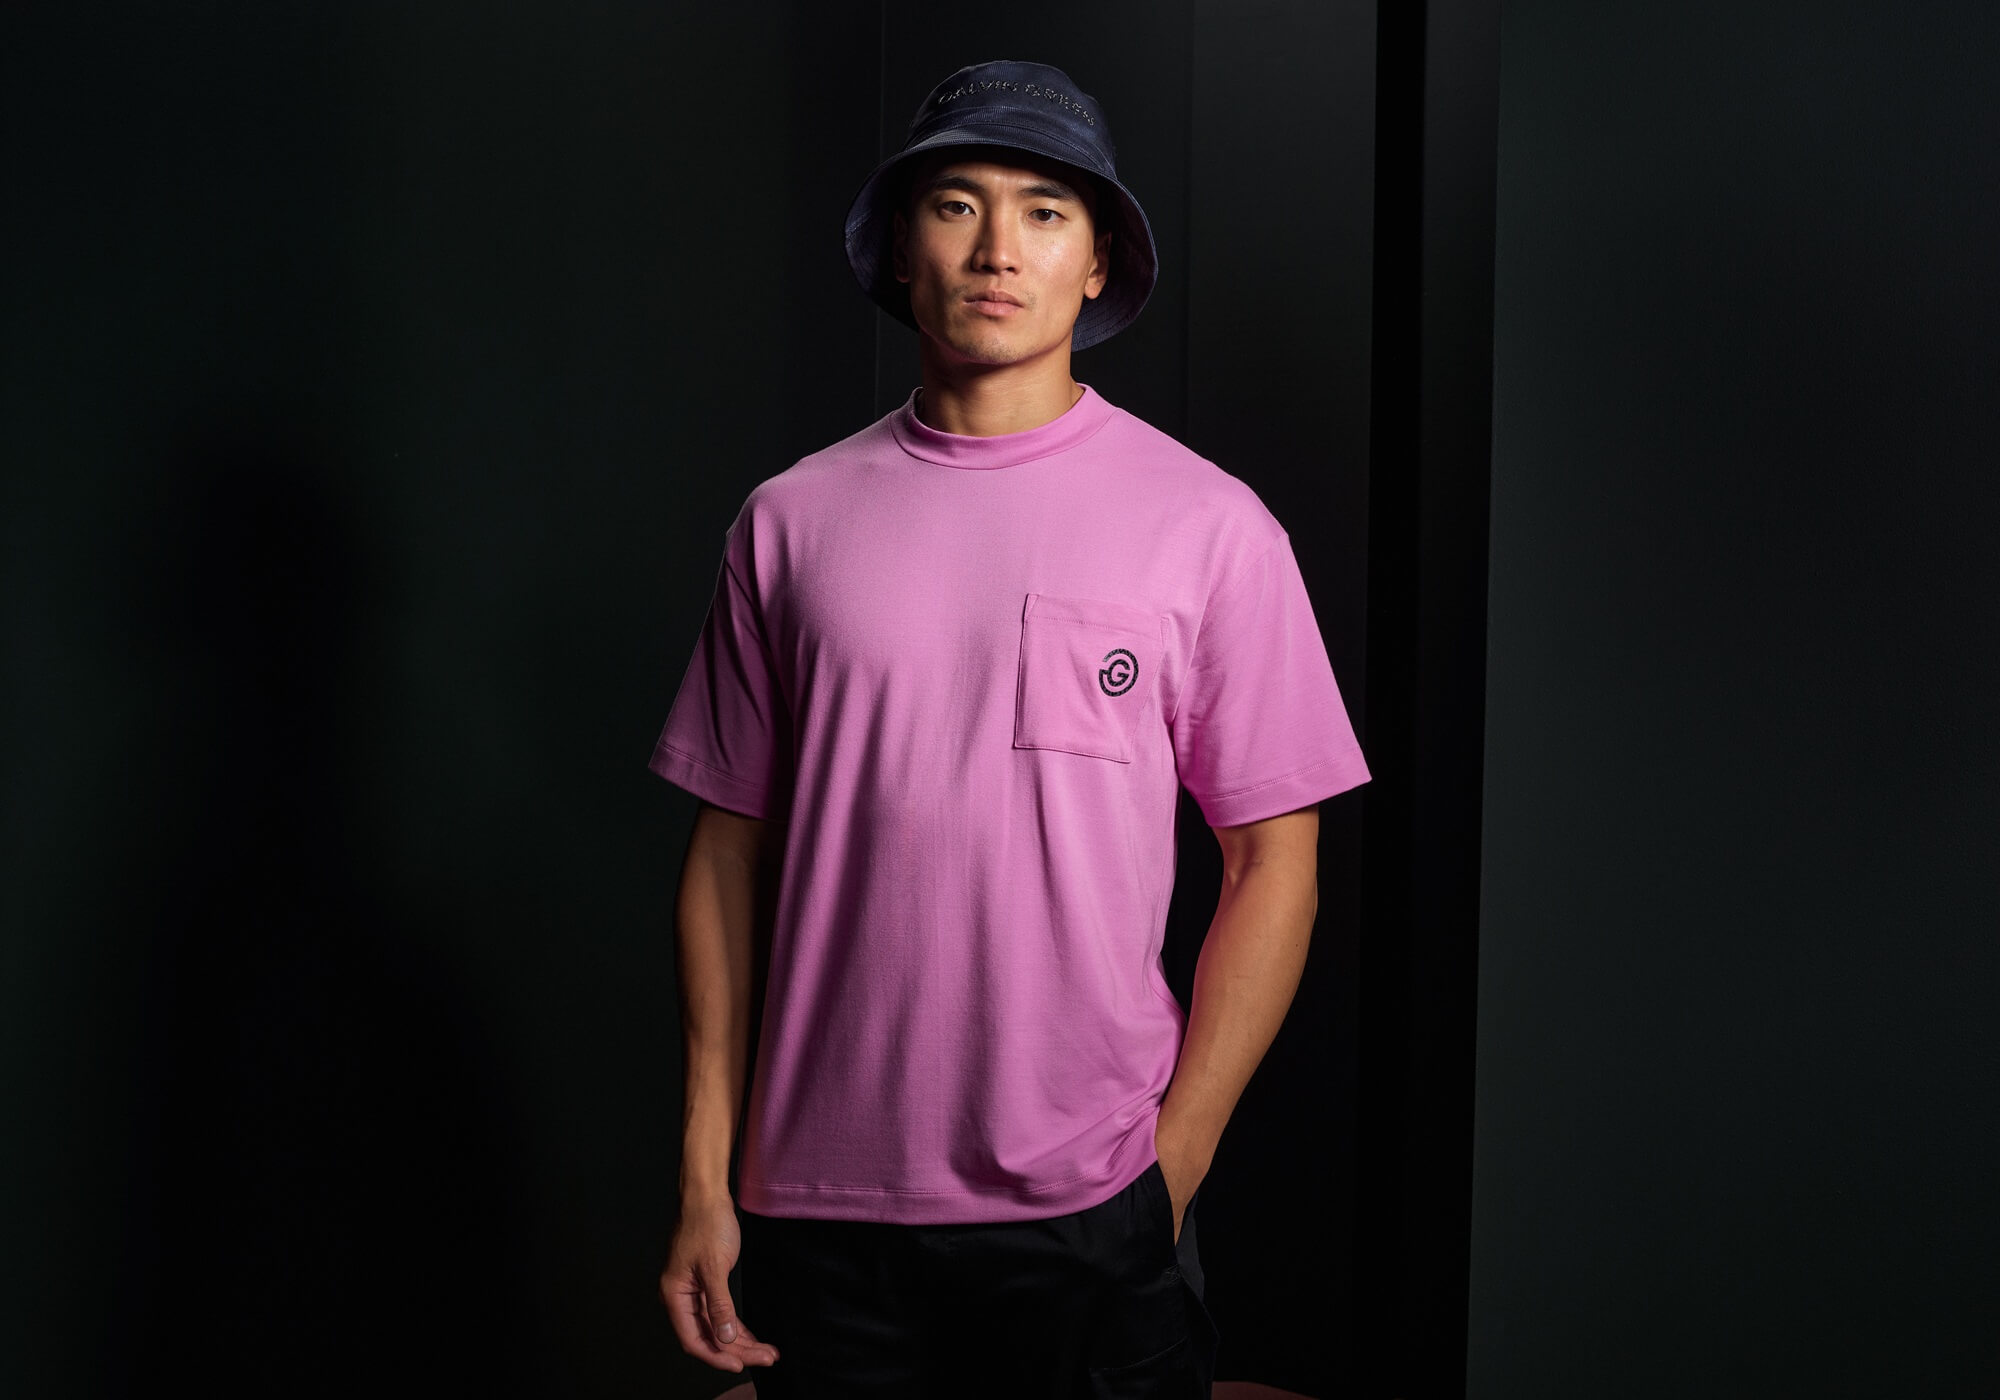
That said, it’s easy to see that I am not the target demographic for Galvin Green’s newest apparel line, the confoundingly named Concept // The Progression.
Technically, Galvin Green is calling it Concept // The Progression capsule. One look confirms that you don’t have to be Christian Dior to know this capsule is designed for golfers much younger than yours truly.
Like, what is a capsule?


Johnson Wagner is now perhaps better known for his bad shots than his good ones, and he revisited the highs and lows of his TV shots in 2025.
The post Johnson Wagner breaks down best (and worst) TV shots of the year appeared first on Golf.
Keegan Bradley recently sat down to talk about his road to Ryder Cup captain and Bethpage Black, a course he used to sneak onto in college.
The post ‘So much trouble’: Keegan Bradley talks sneaking onto Bethpage Black appeared first on Golf.
Former Ryder Cup star and captain Lanny Wadkins, in a Golf Channel interview, jabbed the European team. “Just a bunch of wusses,” he said.
The post ‘Just a bunch of wusses’: Former Ryder Cup star jabs European team appeared first on Golf.
Keita Nakajima’s whiff during the DP World Tour’s FedEx Open de France stunned analysts, and rules were examined.
The post ‘One for the referees’: Pro’s whiff stuns analysts, and rules examined appeared first on Golf.
The Ryder Cup does many (not all) things well, as does the Walker Cup. Each would benefit by learning from one another.
The post What the Ryder Cup and Walker Cup can learn from one another appeared first on Golf.
Fans will be charged when the Ryder Cup visits the Black Course at Bethpage State Park next week. But will they be out of control?
The post This New York Ryder Cup will be crazy. Question is, how crazy? appeared first on Golf.
Golf Channel's Johnson Wagner joined GOLF's Subpar podcast to discuss his TV gig, the Ryder Cup, Scottie Scheffler's dominance and more.
The post Scottie Scheffler’s best quality? Analyst says it’s ‘light years’ ahead of others appeared first on Golf.
© 2025 GolfLynk.com a division of Outdoorsmen.com